Van Beek's blog
Why an investing website and not just relaxing at the beach
Submitted by Van Beek on March 25, 2010 - 10:08Often people ask me why I have started the Stock Trend Investing website. If our system is so good, why would I spend time and effort on this website in stead of just relaxing at the beach? The answer is simple.
To start, I need to explain my motivations behind the Stock Trend Investing website. As told in the About Us section of this website and in my eBook, I have had my experiences with poor investments in the aftermath of the 2000 internet bubble. But I've learned from that, and developed and applied Stock Trend Investing since. I recovered my investments and the last 7 years have been very, very good.

Inspiring Boom and Bust Video for Trend Trading Investors
Submitted by Van Beek on March 24, 2010 - 10:57Trend Trading investors may enjoy this video from Econstories that has almost a million views on Youtube. The clip is not only comic but has also a very serious undertone. In the video, two famous economists from the early hours, explain their opinions and differences between them in a rap.
Enjoy the video!
What is the best week of the month to trade index funds
Submitted by Van Beek on March 23, 2010 - 04:05Does it make a difference during which week of the month you buy or sell your index funds? At Stock Trend Investing we dived into the data and present you here with our conclusions.
We haven’t just looked at every month during the last 13 years. We have also looked specifically at the months that follow directly an “Up” or “Down” trend expectation from Stock Trend Investing. The results are different for each of the considered cases.

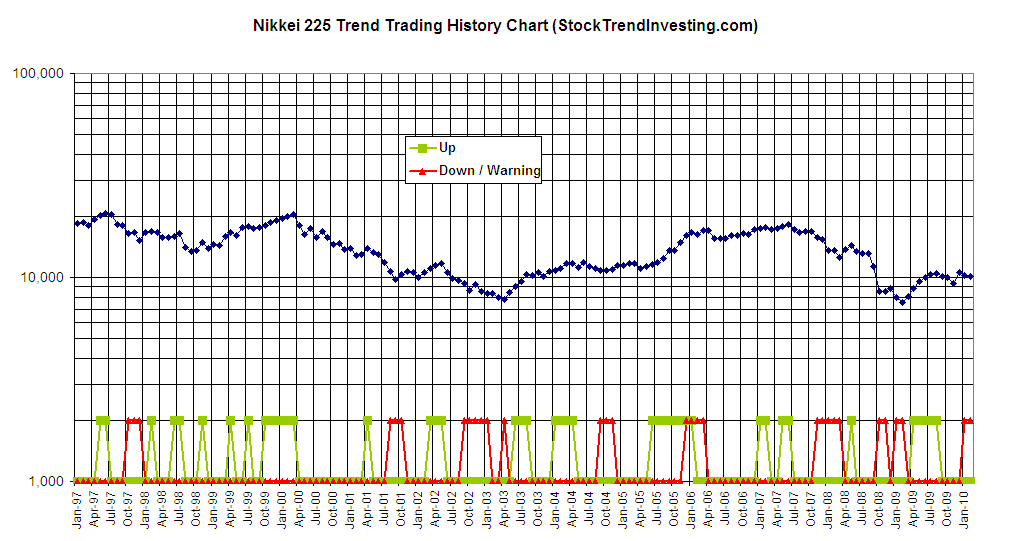
Nikkei Historic Trend Trading Chart - February 2010
Submitted by Van Beek on March 18, 2010 - 07:42Every month, Stock Trend Investing is publishing one of its historic trend trading charts for free. This month, it is the trend trading chart or the Nikkei 225, the index of the Japanese stock market in Tokyo.
The blue line shows the closing price of the Nikkei index for that month.
The green line signals when our Initial Trend Expectation for the Nikkei was "Up". The red line signals when our Initial Trend Expectation for the Nikkei was "Down" or when there was a special warning.
Log in or register on this website to download the chart at the bottom of this page. You can also click and drag the chart to a tab in your browser to see an enlargement.

Trading currencies or how to deal with currency fluctuations
Submitted by Van Beek on March 17, 2010 - 02:51There is a recent trend that non-professional investors step into the currency trading. The major shifts that the US dollar has made versus the Euro during the last year are probably the reasons for this. Why should you be very, very careful before starting to trade in currencies and what can be the impact of currency fluctuations on investors in stocks and funds.
The exchange rate between currencies is developing 24 hours per day. This exchange rate is the price you need to pay in one currency for another. For example, at the time of writing, one needs to pay 1.37 US dollar for every 1 Euro.


