August 2010
What to do with Bonds Bubble, Inflation or Deflation and No Clear Trends in the Stock Markets
Submitted by Van Beek on August 29, 2010 - 05:48What shall anybody who wants to invest his or her money now do when stock markets do not move in any specific direction, the recovery is uncertain and interest rates on savings accounts are still incredible low? I like to have a simple answer. The simple answer is not there yet, but here is some food for thought.

To try to find simple investing strategies that work when there are no clear trends in the stock markets, I am reading and looking what can be done with bonds.
At the same time, a disaster scenario would be where stocks do not move in any long term trend, savings accounts do not provide any substantial interest and inflation starts to soar, eating away all your savings.
Factors contributing to Economic Growth and Causes for Recession and Economic Crisis
Submitted by Van Beek on August 25, 2010 - 10:33Do you also like to have a simple graphic overview of the factors contributing to economic growth and the causes for recession and economic crisis?
The daily economic news does not provide you with this overview. You hear statements about double-dips, a looming recession or even depression, huge growth and surplusses in China, a credit crisis, rising currencies, deleveraging of debts and more of this. Let’s have a look at the fundamental economic patterns behind all this.
Next Step Tool
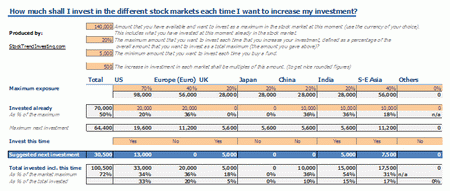
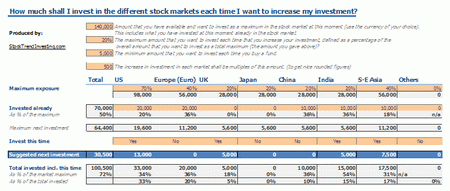
Submitted by Van Beek on August 25, 2010 - 06:30Every time you want to increase your investments in the stock market, you ask yourself how large or small that next investment will be and in which markets to invest. Do you have a system for this? We have developed the Next Step Tool that can help you in making these decision. The Excel based tool can be downloaded at the bottom of this page.

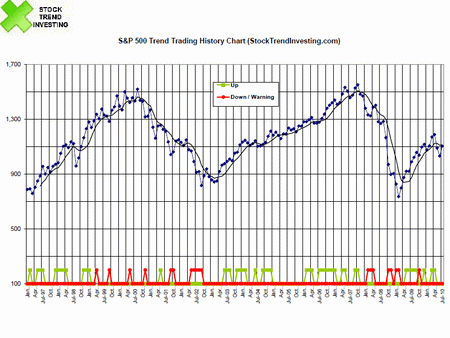
S&P 500 Trend Investing History Chart - August 2010
Submitted by Van Beek on August 17, 2010 - 09:13Every month, Stock Trend Investing is publishing here one of its history charts for trend investing and trading. This month, this is the history chart for the S&P 500 index.

Find here the monthly updated Trend Signals for the
S&P 500. It's free.
USD/JPY 20-Year Exchange Rate Trend and History Chart - July 2010
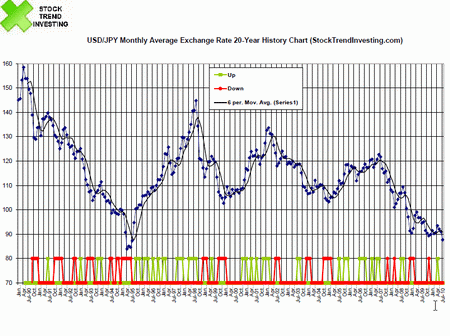
Submitted by Van Beek on August 10, 2010 - 02:55This USD/JPY exchange rate and trend chart shows a 20 year history. The US Dollar - Japanese Yen exchange rate is a lot in the news recently since a Dollar buys less and less Yen's. This is the historic perspective. The trend just continues. Click now here to see the historical trend investing performance and what level of results you can expect.

How to decide how large or small your next investment step shall be?
Submitted by Van Beek on August 7, 2010 - 10:38Every time you want to increase your investments in the stock market, you ask yourself how large or small that next investment will be and in which markets to invest. Do you have a proven system for this? Our community members have asked us how we make these decisions. Here we will share our approach and attached to this blog post is our exclusive Next Step Tool, free for you to use.


