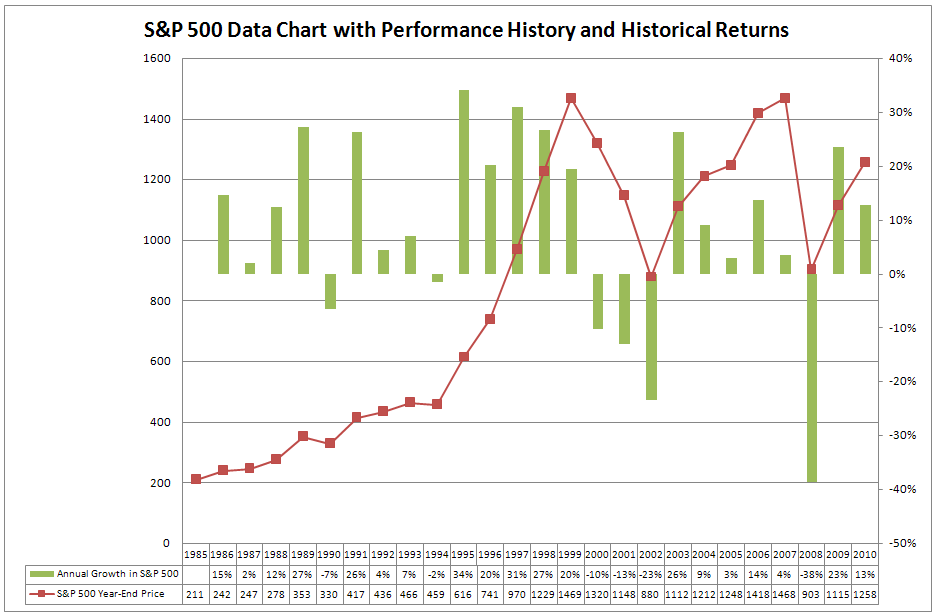
Historical SP500 Returns

To see a larger version of this historical SP500 returns chart, download the attachment at the end of this page or click and drag the chart to a new tab in your browser.
When I reviewed in January 2000, the historical SP500 returns, I came to the conclusion that I was mad not investing in the stock market. I was earning a good wage. But my friends were making way much more money with their stock market investments.
I could no longer stand on the sideline and started to invest my savings in the stock market. We all know what happened after that. The returns of the SP500 in the year 2000 were a minus 10%.
The chart below shows that also during 1990 and 1994, the SP500 returns were negative and that these years were followed by years with very good returns. With this historical perspective in mind, I had nothing to fear. But reality turned out different.
My Lesson from Watching the Historical SP500 Returns
The mistake I made in those days was that I just looked at the historical returns of the SP500. What I did not do then was to review the direction of the trend in the SP500 on a regular basis.
Now I know better. On a monthly basis I review a number of Trend Signals for that SP500 that tell me the direction of the long-term trend. These signals told me to sell the funds I owned at the end of 2007 and to buy them back in the beginning of 2009.
Click here to see the latest Trend Signals for the S&P 500 that I am using.
You will get an instant overview of the current long-term trend direction for the S&P 500. Having objective measures of the current trend in the S&P 500 can help also you to improve the returns on your investments.

