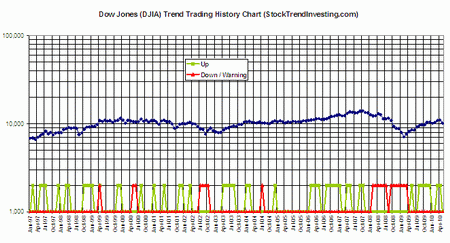
Dow Jones Industrial Averages DJIA Trend Trading History Chart - May 2010
Every month, Stock Trend Investing is publishing one of its trend trading history charts for free. This month, it is the trend trading chart for the Dow Jones Industrial Averages (DJIA) index.
In the chart, the blue line shows the closing price of the Dow Jones Industrial Averages index for that month.
Click here to go to the free Guide on Trend Signals that tell you when to buy and sell.
The green line signals when our Initial Trend Expectation for the Dow Jones Industrial Averages was "Up". The red line signals when our Initial Trend Expectation for the Dow Jones Industrial Averages was "Down" or when there was a special warning.

Dow Jones Industrial Averages (DJIA) index trend trading history chart
Just looking at the Dow Jones index chart, we see that the market decline during May has put the up-wards trend on-hold for the moment. However, to get a better picture for the overall trend in the US market, we do not look at just the Dow Jones index history trend chart but we also update monthly the history trend trading charts for the Nasdaq and S&P 500.
Here you'll find the monthly updated long-term trend trading signals for the S&P 500.
When you start trend trading the Dow Jones Industrial Averages, make sure you have always access to the latest trend indicators.
Click here to sign up for the free Trend Investing email newsletter.
Next & Previous Blog Post
- ‹ previous
- 37 of 174
- next ›


