Historical Results

To grow your savings and protect your wealth, you want avoid the massive downturns in the stock market. Since the situation for every person is different, you want to be able to select a trend signal that matches your risk profile.
The best way to do that is to see the historical results for the different trend signals. Here are the historical results when using these different signals when trend following the S&P 500 with an S&P 500 index fund. These trend signals indicate when to step in the market and when to move out the market.
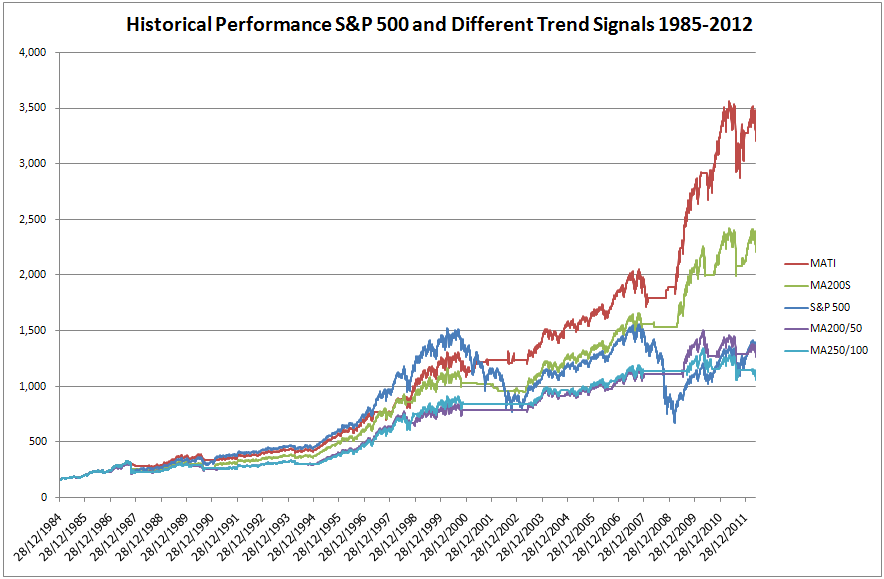
<Click on the chart to see a larger version: MATI (red line) beats index (blue line).>
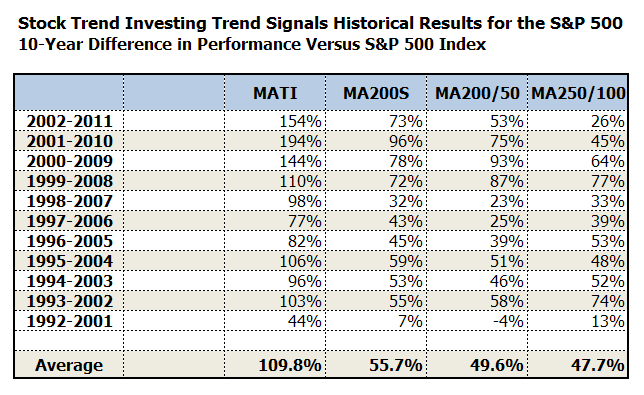
Our flagship (proprietary) trend signal is the MATI (red line in chart above). For the last 20 years, trend following the S&P 500 with the MATI trend signal outperforms the index for each period of 10 years on average with 110% (that is 110% more, not just 10%). See the table below for proof.
Historical Results for 10-Year Periods
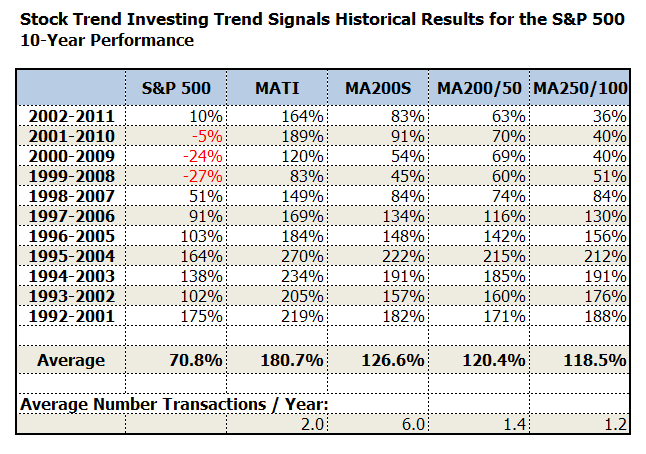
The columns in the table below show the historical results for the S&P 500 index and when trend following the S&P 500 with a certain trend signal. The table shows the returns for four different trend signals (MATI, MA200S, MA200/50, MA250/100). Further below you'll fnd a short introduction to each of these trend signals.
<Click on the table to see a larger version.>
The MATI provides an average return of 180.7% for a 10-year period versus 70.8% for the S&P 500.
The MATI outperforms the S&P 500 on average by 109.8% for a 10-year period.
Please note that the Stock Trend Investing system was only developed in 2003. Results from before are based on back-testing.
Further below you'll find:
- Annual results of each signal for the last 20 years in a simple table format.
- The answer to the question which signals would have gotten you out of the market early enough to escape from the crashes and massive downturns of 1987, 2001 and 2008.
Description Trend Signals
The MA200/50 and MA250/100 trend signals are straight forward signals that are based on buying/selling when the shorter moving average crosses with a certain percentage the longer one.
Thus you get a buy indicator when the 50-day (100-day) moving average ends up above the 200-day (250-day) and a sell-indicator when the shorter one goes below the longer one.
We use these signals universally for all the stock market indices that we analyze.
The MA200S is special proprietary signal for the S&P 500 that we have not published yet. It is based around the 200-day and some other simple moving averages. It triggers buy and sell indicators when the closing price moves in a certain way in relation to these moving averages.
The MATI is our most advanced (and proprietary) signal. To its core are the 200-day and 50-day moving averages; but it includes a few simple but effective additional calculations as well.
The MATI could provide for example sell warnings when the MA200/50 still indicates that the trend is up, or buy signals when the MA200/50 is still down. And it tells you when to ignore the buy and sell signals generated by the MA200/50.
For further reading on the different trend signals, find here our free online guide and download here the PDF version.
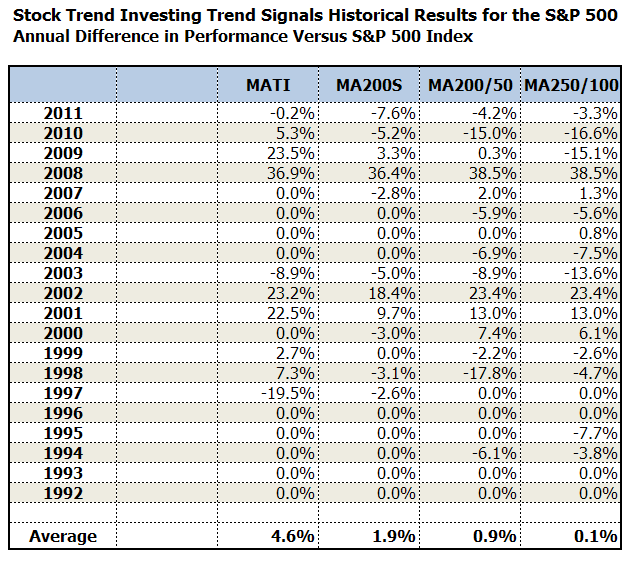
Historical Annual Results
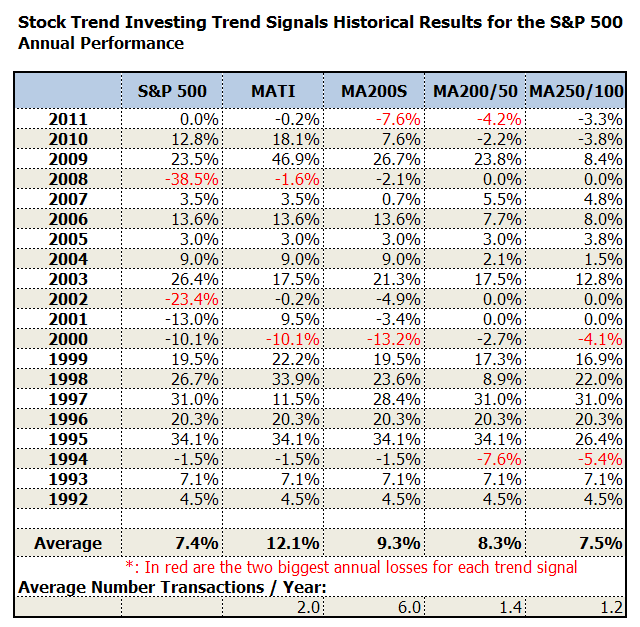
The average annual return for the MATI is 12.1% versus 7.4% for the S&P 500.
As a breakdown of the 10-year period results shown above, find here the historical annual results for the different trend signals in relation to the S&P 500.
Go through the results and see what performance with gains and losses appeals most to you. What would be your favorite trend signal that matches your risk profile?
On average the MATI provide 4.6% more return per year than the S&P 500.
The Crashes of 1987, 2001 and 2008
During the last 30 years, we have seen 3 major market downturns:
- The market crash in 1987.
- The market and dot.com bubble collapse in 2001.
- The financial crisis and market downturn in 2008.
These downturns could have wiped out each between the 35% to 55% of your savings and wealth.
The Stock Trend Investing system was developed in 2003 based on analysis and back-testing to 1990. We were happy to see in 2008 that the system worked and moved us early enough out of the market to escape the biggest downturn of the last 7 years.
Only recently, we tested the signals back to 1985 to see how they coped with the 1987 crash. We were very happy to see that the MATI generated a sell indicator before the crash. The 1987 was an extremely sudden and steep crash. None of the other signals generated in time a sell signal to avoid that down-turn.
Of course this does not give any guarantee that the MATI will generate a sell indicator before the next sudden and very steep crash. No single signal can give that guarantee; but the MATI has proven itself well, both in 1987, 2001 and 2008.

