Trend Indicator to Manage Your Risk

What do you do with your index funds when the long-term trend still points up but recent market declines could also be the start of a new massive downturn? The answer depends probably on your attitude towards risk. Here is a tool that we have developed to help you in making these decisions.
More risk-prone investors would like to hold on to their funds. In case the market re-bounces, they avoid any loss and are well positioned to capitalize on the coming bull market. They accept some additional losses in the case the market trend really turns down.
As a more risk-averse investor, you may want to sell and reduce your holdings already. You would take a limited loss now and avoid higher losses if the market goes further down the coming months. And in case the market now re-bounces, you would accept it that you miss the initial gains of the re-start of the uptrend.
Long-Short Strength Indicator
The trend signals that we use (like the MATI) are very black and white: the long-term trend is up or down. To help you to make the decisions on when to enter and exit the market or increase or reduce your holdings, we have created a new Long-Short Strength Indicator (LSSI).
The LSSI can be calculated at the end of each trading day for each stock market index to signal the direction of the long-term trend (in terms of months) and the likelihood or risk that the trend changes direction.
The LSSI can have 5 different levels:
- Full short
- Part short
- Look out
- Part long
- Full long
Part Short and Full Long
"Full short" signals a pure trend down with no indications (yet) of a possible turn around. 'Full long" indicates a pure trend up with no warnings (yet) of a possible turnaround.
When a stock market index is moving from a clear down trend (Full short) to a “Part short” state and then to the “Look out” state, a turnaround and beginning of a long-term uptrend is getting more likely. Similar, when a stock market index is in the “Full long” state and is moving to the “Part long” and then “Look out” state, a turnaround and beginning of a long-term down trend is getting more likely.
A more risk averse investor could scale back or hedge their long or short positions when an stock market index move from “Full” to “Part” and “Look out”. Someone who accepts more risk could stay fully invested until the trend signal like the MATI indicates a change in direction.
Look Out
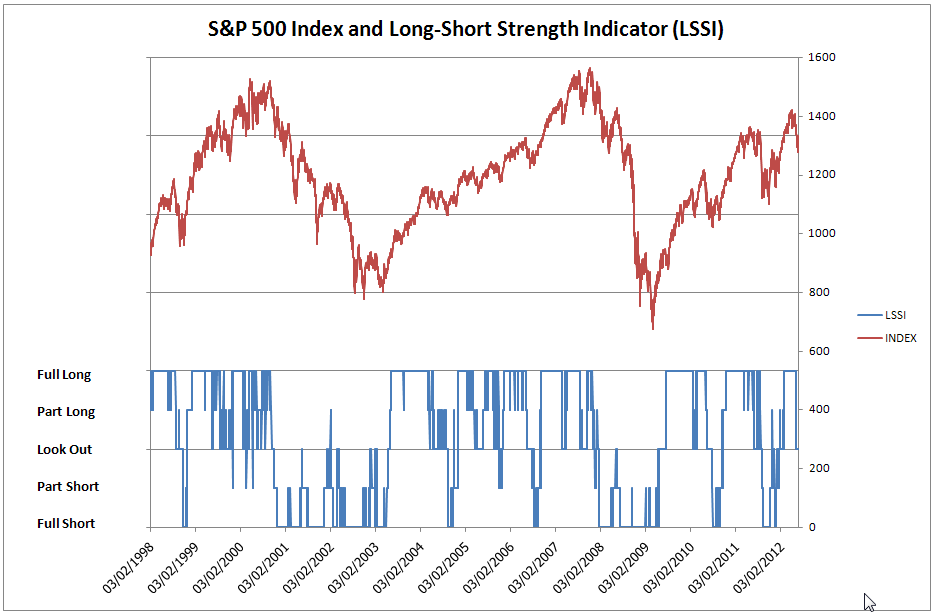
Currently (2nd week of June 2012), the S&P 500 and DAX are in the "Look out" state coming from a "Full long” at the end of April 2012.
The "Look out" state is the state where historically the trend turns back where it came from (being long or short) or it switches direction. Historically "Look out" is followed more by "long" than by "short" but that is probably since markets have gone up the last 30 years.
"Look out" could imply to go "out" or in cash or to hold on to your positions. The LSSI is not a trend signal like our MATI with a proven historical performance; it is a long-short strength indicator. It is not designed to tell you when to move from long (up) to short (down) and vice versa. It has this “Look out” state that can persist for weeks.
LSSI versus Index
Above is a chart (click on it to see a larger version) that shows historically how the LSSI has moved compared to the S&P 500 Index. So far, we have not published the LSSI yet and we are thinking how we could do this best as part of our membership section.
Now we would like to know what you think of all this. What do you think of this LSSI? Would such an indicator be very useful for you? If so, for what stock market indices would you like to see it? When and how would you like to be informed with regards to the level and changes in the LSSI for these indices?
Your thoughts on this would be very much appreciated. Please share your opinion in the comments below or tell us via the contact form.
Next & Previous Blog Post
- ‹ previous
- 148 of 174
- next ›


