About half of our Stock Trend Investing members invest just in the U.S. markets. The other half invest internationally. You need to know a few things extra when you want to invest your savings in international markets compared to when you invest domestically only. At Stock Trend Investing, we want to help in you in getting the required understanding and insight.
Last month, I explained why the 4% gain of the NASDAQ was worth more than the 7% gain of the Japanese index. It all had to do with movements in the currency exchange rate.
In this post, you will see two charts that can clarify that a little more.
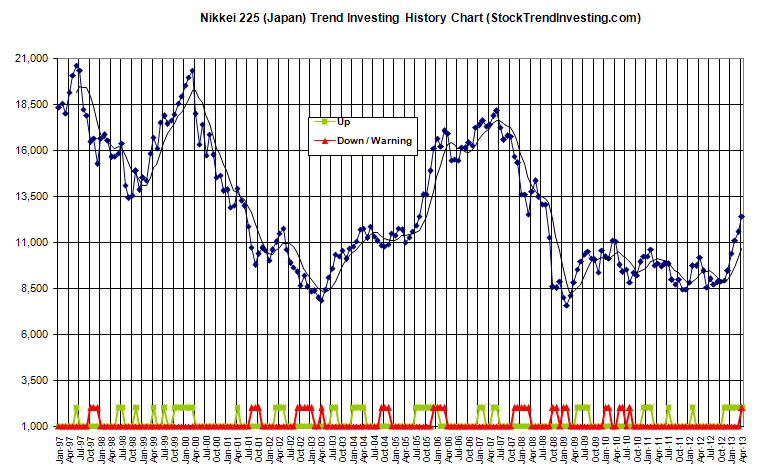
Nikkei Trend Chart
The first chart here shows the development in the Nikkei (in Japanese Yen) during the last few years. See that nice move up the last few months. Wow, these are some nice gains.
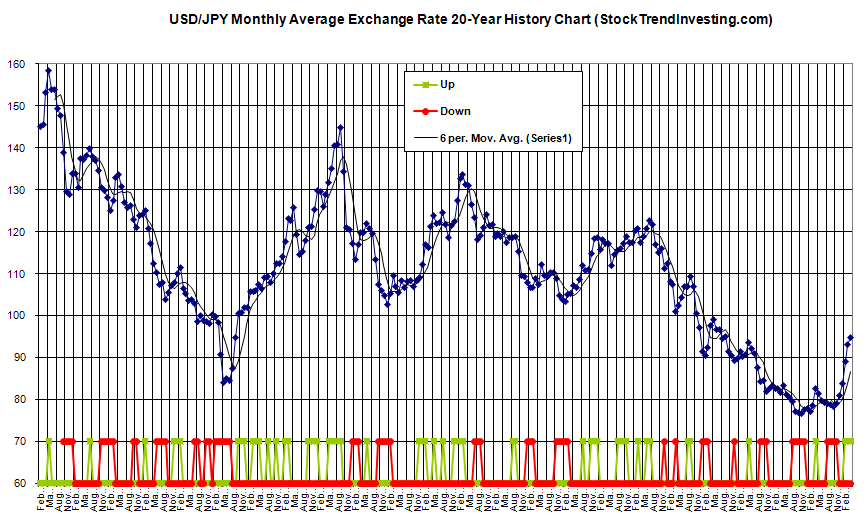
Japanese Yen Exchange Rate Chart
However, here is the second chart. This graph shows how many Japanese Yen you can buy for one U.S. Dollar. Yes, do you see the similar move up during the last few months? This move up shows that the Yen is losing value versus the Dollar.
Thus the first chart shows how much the Nikkei gained in value (measured in Yen) during the last few months. And the second chart shows that these Yen have become less worth in Dollars during the same last few months.
Sign up now for our free investing newsletter if you want to invest internationally and make money with trends.


