- End of 12 Years of Monthly Stock Market Trend Updates
- Alternative Services for Trend Signals
- S&P 500 Trend Signal Email Alert
- Two Favorite Economics and Investment Newsletters
- Get Email Alert When S&P500 Trend Turns Down
- Currencies Impact Stock Market Profits
- Trend Investing Whip-Saw Reality
- Not Trend Following But Trend Investing
- How to Invest My Savings Safely for Good Long-Term Returns?
- Does Trend Trading the ASX Work?
S&P 500 Performance History and Month-end Trend Signal
May 9, 2012 - 11:23 — Van Beek

The chart below shows the development in the monthly closing price of the S&P 500.
The red and green lines indicate the “Up” and “Down/Warning” signals as generated by the Month-end Trend Signal.
You can download a larger version of the chart below at the bottom of this page. Or click and drag the chart to a new tab in your browser.
Note this is an older chart. Get here the long-term trend signal email alert for the S&P 500.
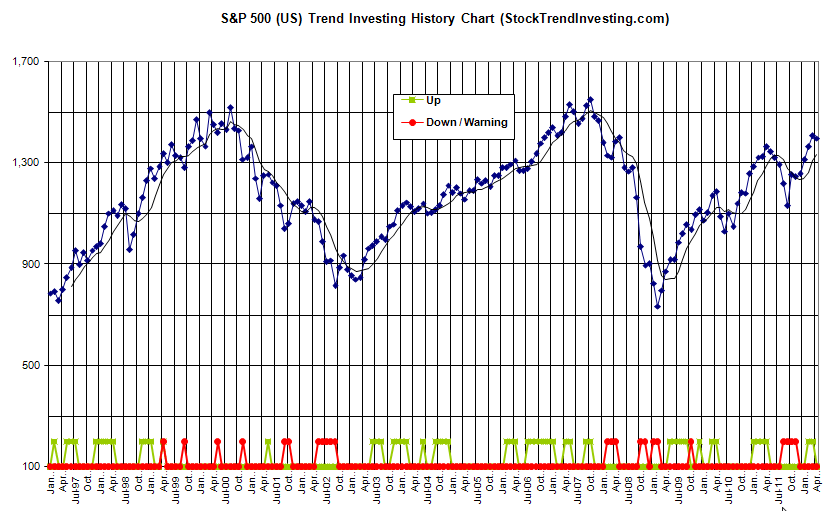
The chart above has been updated after the closing of April 2012.
As Stock Trend Investing member, you can find every month the updated Month-End Trend Signal for the S&P 500.
Other S&P Performance History Charts and Analysis
- Historical results of the S&P 500 index versus the MATI trend signal
- S&P 500 Performance History Chart
- Get better annualized returns from S&P 500 index funds
Besides the S&P 500 trend signals, we also publish a free email-newletter for investors with a long-term horizon.
Click here to sign up for the free Trend Investing email newsletter.
or
Click here to get the free Guide to Month-end and Other Trend Signals.
Claim Your Free eBook:
"GROW YOUR SAVINGS &
AVOID THE DOWNTURNS"
and Get the Free Newsletter
that Helps You to Grow and
Protect Your Wealth