trend
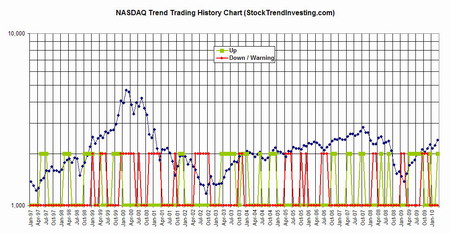
Nasdaq Historic Trend Trading Chart - March 2010
Submitted by Van Beek on April 8, 2010 - 12:24Every month, Stock Trend Investing is publishing one of its historic trend trading charts for free. This month, it is the trend trading chart or the Nasdaq.
The blue line shows the closing price of the Nasdaq index for that month.
The green line signals when our Initial Trend Expectation for the Nasdaq was "Up". The red line signals when our Initial Trend Expectation for the Nasdaq was "Down" or when there was a special warning.

Click and drag the chart to a tab in your browser to see an enlargement.
Inspiring Boom and Bust Video for Trend Trading Investors
Submitted by Van Beek on March 24, 2010 - 10:57Trend Trading investors may enjoy this video from Econstories that has almost a million views on Youtube. The clip is not only comic but has also a very serious undertone. In the video, two famous economists from the early hours, explain their opinions and differences between them in a rap.
Enjoy the video!
Stock Exchange Trend
Submitted by Van Beek on March 20, 2010 - 04:48The stock exchange trend is the trend in the index of that stock exchange. Each stock exchange has its own index. This is a composite of a number of important stocks that are listed on that stock exchange.
Stock Trend Investing follows the stock exchange trend for a number of important stock exchanges around the world. For the US for example, the NYSE and NASDAQ stock exchanges are covered. But we cover as well as the Dow Jones and S&P 500 indices.
Note that these last two indices are indices that are composites of stocks that are listed on the first two mentioned stock exchanges. However, they are not the index of that stock exchange. We also cover the trends of at least 4 European stock exchanges and 4 Asian stock exchanges.
Stock Market Trend Analysis
Submitted by Van Beek on March 19, 2010 - 17:34Stock Trend Investing is specialized in Stock Market Trend Analysis. Every month we analyse and review the trends in a number of major stock market indices. Yes, we review it every month, not every day. The reason for that is that the typical user of the Stock Trend Investing system does not have time to trade every day. Our users only want to spend maximum one hour per month on their investments.
Therefore, Stock Trend Investing is performing a specific monthly stock market trend analysis. If the user of the analysis only wants to trade once per month, the analysis has to be targeted to that. Likewise, a trend investor who wants to trade every day needs a daily stock market trend analysis.
Stock Trend Signal
Submitted by Van Beek on March 17, 2010 - 16:46A Stock Trend Signal indicates the current trend in the stock market. Stock Trend Investors use stock trend signals to decide when to invest in the stock market and when to sell the equities they hold.
In the Stock Trend Investing system, we have stock trend signals that show us every month if we expect the market index to go “Up”, to go “Down” or to be “Unclear”. An “Unclear” signal means that we do not see a clear trend up or down.
The stock trend signals for individual stock market indices are called Initial Trend Expectations. At Stock Trend Investing, we cover a number of major stock market indices in the US, Europe and Asia.
Trend Trading
Submitted by Van Beek on March 13, 2010 - 14:19Trend trading is a generic term for a number of different approaches that are used to invest in the stock market. Stock Trend Investing is a form of trend trading. In this article we will high light the differences between our form of trend trading and other existing alternatives.
Different trend trading systems focus on trends of different lengths. Stock Trend Investing focuses on long term trends that are expected to last at least a number of months, but sometimes years. Members of the Stock Trend Investing community review their positions only once per month. This is especially suitable for people who cannot or do not want to spend every day or week a certain amount of time on their investments.
Six reasons why we love trend investing
Submitted by Van Beek on November 17, 2009 - 16:28Who else wants to ride stock market trends to create a fortune?
Submitted by Van Beek on November 3, 2009 - 16:12


