- End of 12 Years of Monthly Stock Market Trend Updates
- Alternative Services for Trend Signals
- S&P 500 Trend Signal Email Alert
- Two Favorite Economics and Investment Newsletters
- Get Email Alert When S&P500 Trend Turns Down
- Currencies Impact Stock Market Profits
- Trend Investing Whip-Saw Reality
- Not Trend Following But Trend Investing
- How to Invest My Savings Safely for Good Long-Term Returns?
- Does Trend Trading the ASX Work?
Historical Results
<Dear visitor. Our service is only for investors who understand the performance that can be achieved with this type of trend signals. Below shows the dates and level that the S&P 500 turned.
Not every move is always positive, like in the 2nd half of 2002 till Q1 2003 and end 2011. However avoiding the down trends in 2008 and 2001 compensates for all this.
Therefore, we do not update the performance records below. You can make your own calculations. Just be aware that our Gold Membership and S&P 500 Email alert services are still available as normal. This is just an explanation why the page below is not updated till todate. But please check the historic records below to see what to expect.>
The MATI Trend Signal shows the best performance and highest returns of all the Stock Trend Investing trend signals. By following this signal, you would have moved out of the market in time and avoided the market crashes of 1987, 1998, 2001 and 2008.
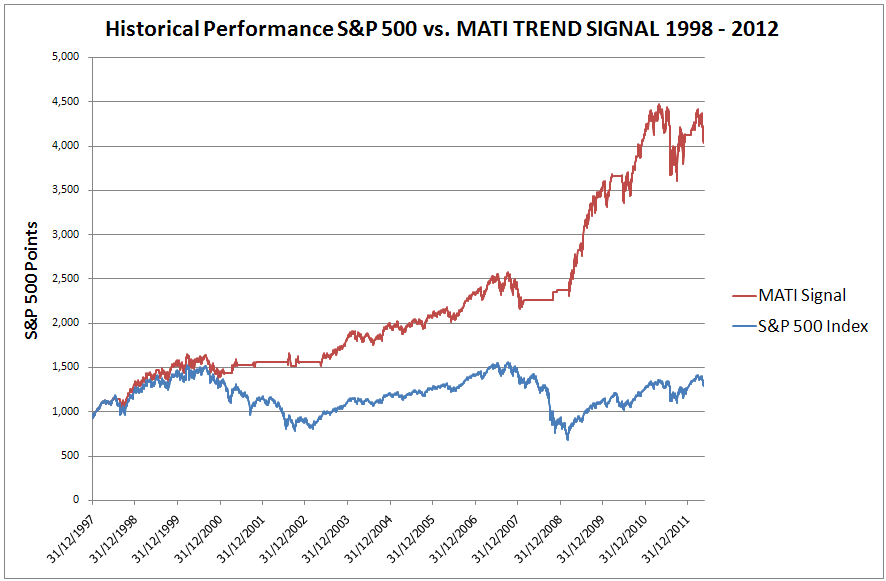
For the period from 1998 till 2012, you would have gained over 300% higher returns by following the MATI Trend Signal compared to buying and holding an S&P 500 Index Fund (see chart below).
Click on the chart to see a larger version.
MATI Trend Signal (red) beats S&P 500 (blue) by over 300%.
The MATI Trend Signal indicates when to step in the market and when to move out of the market. On average, you only buy or sell twice per year when you follow the MATI Trend Signal.
Note that since the beginning of 2012, the MATI is pointing up and MATI trend followers have made the same returns as the S&P 500. Read more here.
Historical Performance for 10-Year Periods
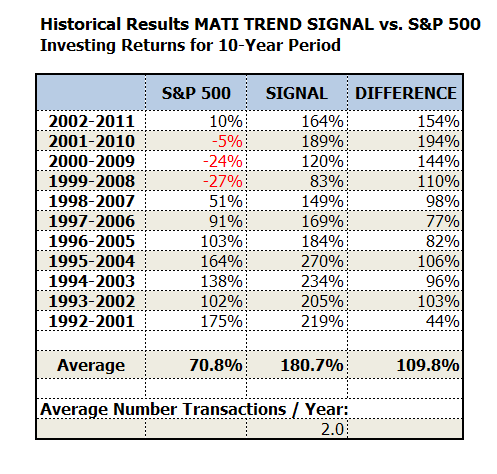
The table below shows the performance of the MATI Trend Signal versus the S&P 500 for all 10-year periods from 1992 to 2011. The “Difference’ column shows how much higher your returns are when you follow the MATI Trend Signal.
On average the S&P 500 provides a return of 70.8% for a 10-year period. The MATI Trend Signal provides a return of 180.7%. Thus, following the MATI offers 109.8% more return on investment than buying and holding the S&P 500.

Get 109.8% higher return on investment when following the MATI Trend Signal compared to buying and holding S&P 500.
Historical Annual Results
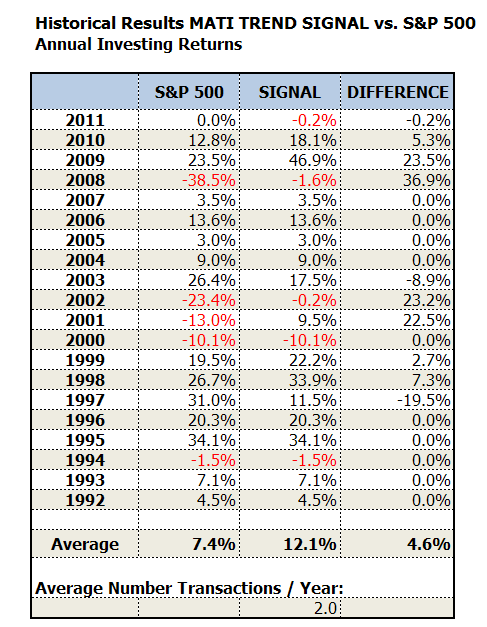
The table below shows the annual performance of the MATI Trend Signal versus the S&P 500. Note that with the MATI you avoid the biggest annual downturns in the S&P 500.

The MATI provides on average a 4.6% higher annual return on investment compared to the S&P 500.
This 4.6% higher annual return may not seem such a big difference. Just remember that with such a better return, year over year, this results in getting a performance that is over 300% better when compounded over 14 years like in the chart above.
If you are interested to see how the MATI Trend Signal compares to our other trend signal and you like to see what trend signal matches your risk profile best, read more here.


