- End of 12 Years of Monthly Stock Market Trend Updates
- Alternative Services for Trend Signals
- S&P 500 Trend Signal Email Alert
- Two Favorite Economics and Investment Newsletters
- Get Email Alert When S&P500 Trend Turns Down
- Currencies Impact Stock Market Profits
- Trend Investing Whip-Saw Reality
- Not Trend Following But Trend Investing
- How to Invest My Savings Safely for Good Long-Term Returns?
- Does Trend Trading the ASX Work?
December 2012
How High and Long Is Gold Going Up
December 1, 2012 - 11:24 — Van BeekYou would like to know how long gold is going and how high it is going up. When you have this information, investing and making money is easy. With this information you know exactly what call options to buy or when to sell your Gold ETF or futures.
At the time of writing, I am “long” gold. But here is the crux. I’m long gold without knowing how long and how high this commodity will increase in price. I actually acknowledge the fact that my bet could turn out wrong and that gold will from now onwards only decline in price.
Why Long Gold
Trends in Currency Exchange Rates
December 1, 2012 - 05:40 — Van Beek|
Trends in currency exchange rates are important for Stock Trend Investors who invest outside their home currency zone. A foreign market index could move up but the currency for that market could devalue compared to your home currency. In that case, your gains measured in your home currency would reduce or could even turn negative. |
Moving Averages and Day-End Market Timing Signals
December 1, 2012 - 05:39 — Van Beek|
Attached to this page are our latest Long-Term Market Timing Signals based on Moving Averages and Analysis of daily closing prices of the major stock market indices. The attached Powerpoint presentation file is updated after the closing of November 2012.
This is a new section of the Stock Trend Investing website. For 16 market indices, the following long-term market timing tools are provided: |
Trend Investing Index Charts
December 1, 2012 - 05:38 — Van Beek|
Attached to this page are our latest Trend Investing Index Charts. The attached charts are updated after the closing of November 2012. Currently we provide these charts as a Powerpoint presentation file. It is easy to download and easy to view. If you like to get these charts in a different format, please let us know and we will try to accomodate you. Each chart shows the following 3 items: 1) The monthly closing price for that index for the last decade or longer |
Trend Dashboard and Comments by Market and Region 2012
December 1, 2012 - 05:36 — Van BeekHere you find our latest conclusions and commentary on the observed
stock market trends by region and market.
We recommend reading this page on a monthly basis. Do not hesitate to contact us
with your questions and thoughts on what we have written here.
December 2012

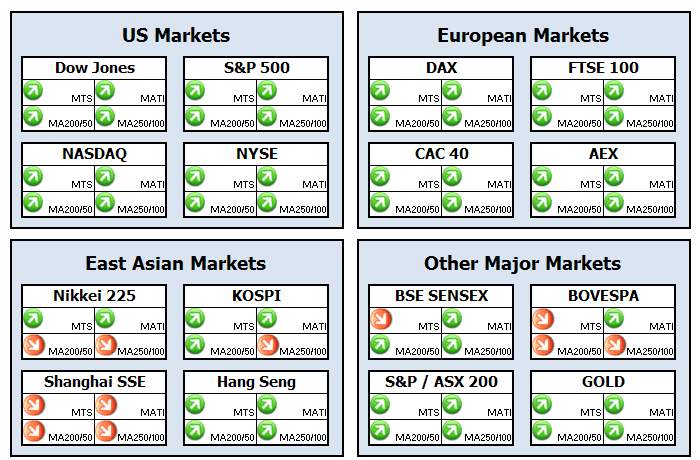
Like last month, for none of the markets the MATI trend signal has changed direction. Thus, I keep my positions unchanged.
The MATI points up for all markets, except for the Chinese Shanghai Composite Index.
